Oracle Security Patches
SECURITY ALERTS + LINKS TO THE PATCHES https://www.oracle.com/security-alerts/ We would like to inform you that it’s patching day again, even though
Read More
SECURITY ALERTS + LINKS TO THE PATCHES https://www.oracle.com/security-alerts/ We would like to inform you that it’s patching day again, even though
Read More
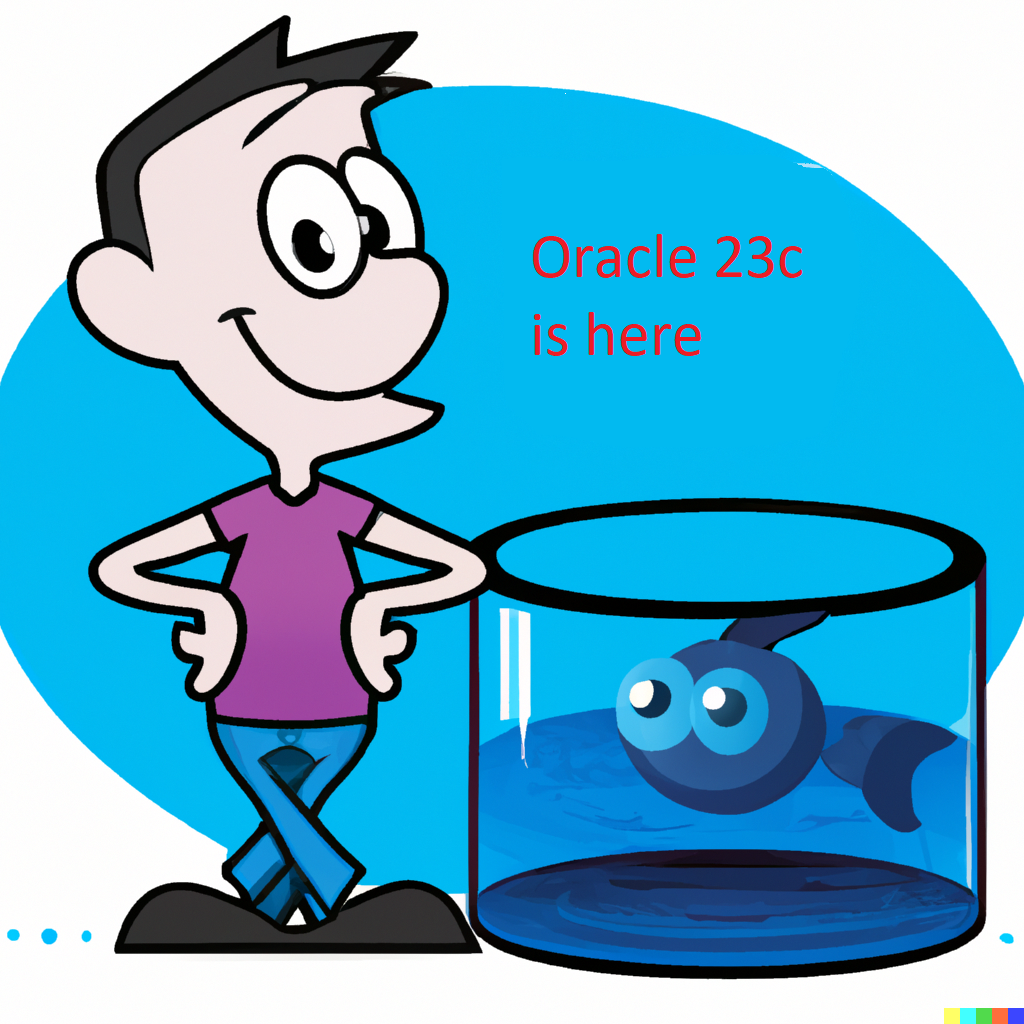
As a database developer, I’m sure you’re aware of the importance of staying up-to-date with the latest technology. Oracle 23c is
Read More
Introduction If you’re like me, you’ve probably used pie charts in the past to visualize data. But after a while, I
Read More
A heat map is a graphical representation of data in which different values are represented by different colors. In a BI
Read More
Introduction If you’re looking to explore the power of bubble charts, Hans Rosling is the man to turn to. A Swedish
Read More
After a new installation of an Oracle 19 CDB+PDB database we always look at the alert.log. And there were 2 anomalies:
Read More
Database links in Autonomous Database Shared are the past – Cloud links are the future Hermann BAER – Oracle PRODUCT MANAGEMENT
Read More
Sankey diagrams can be useful in analyzing voter behavior in elections. They can visually represent the flow of voters between different
Read More
Introduction Are you feeling overwhelmed by box plots? If so, you’re not alone! Interpreting data can be a daunting task, but
Read More